Maximum intensity Projection (MIP) plot
Visualization of 3d categorical or numerical values with maximum intensity projection.
[2]:
%matplotlib inline

import anndata
from spacipy import mip_spatial
[3]:
adata = anndata.read_h5ad('../_static/data/example.mipplot.h5ad')
[4]:
adata
[4]:
AnnData object with n_obs × n_vars = 1260 × 5
    obs: 'spc', 'x', 'y', 'z'
[5]:
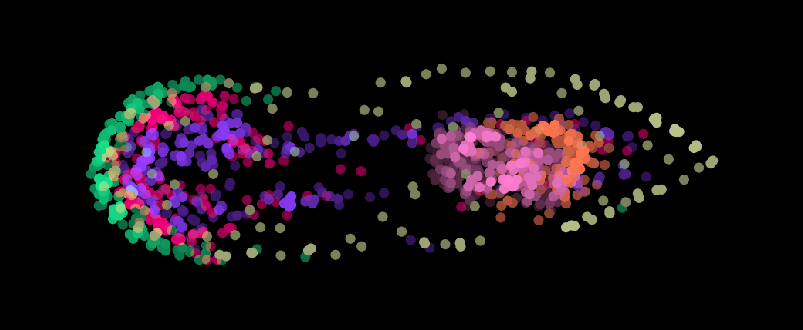
adata.obs['spc'] = 'c' + adata.obs['spc'].astype(str)
adata.obs['spc'].unique()
[5]:
array(['c25', 'c28', 'c31', 'c19', 'c30', 'c29'], dtype=object)
[6]:
adata.uns['3d_spatial'] = adata.obs[['x', 'y', 'z']].values
[7]:
color_dict = {
    'c25': '#8c3bff',
    'c28': '#f2007b',
    'c31': '#15e18c',
    'c19': '#ff7ed1',
    'c30': '#bac389',
    'c29': '#ff7752'
    }
[8]:
mip_spatial(adata,
            color='spc',
            cmap=color_dict,
            ps=1
            )
<Figure size 886x274 with 0 Axes>
<Figure size 886x274 with 0 Axes>
<Figure size 886x274 with 0 Axes>
<Figure size 886x274 with 0 Axes>
<Figure size 886x274 with 0 Axes>
<Figure size 886x274 with 0 Axes>
[9]:
adata.var
[9]:
| SMESG000004222.1 |
|---|
| SMESG000066476.1 |
| SMESG000005043.1 |
| SMESG000068488.1 |
| SMESG000008973.1 |
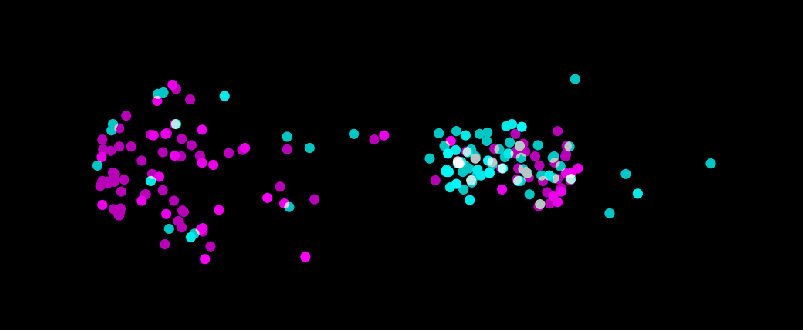
[10]:
cyan = '#00FFFF'
magenta = '#FF00FF'
colors = [cyan, magenta]
genes = ['SMESG000008973.1', 'SMESG000005043.1']

mip_spatial(adata,
            color=genes,
            cmap=colors,
            ps=1
            )
<Figure size 886x274 with 0 Axes>
<Figure size 886x274 with 0 Axes>